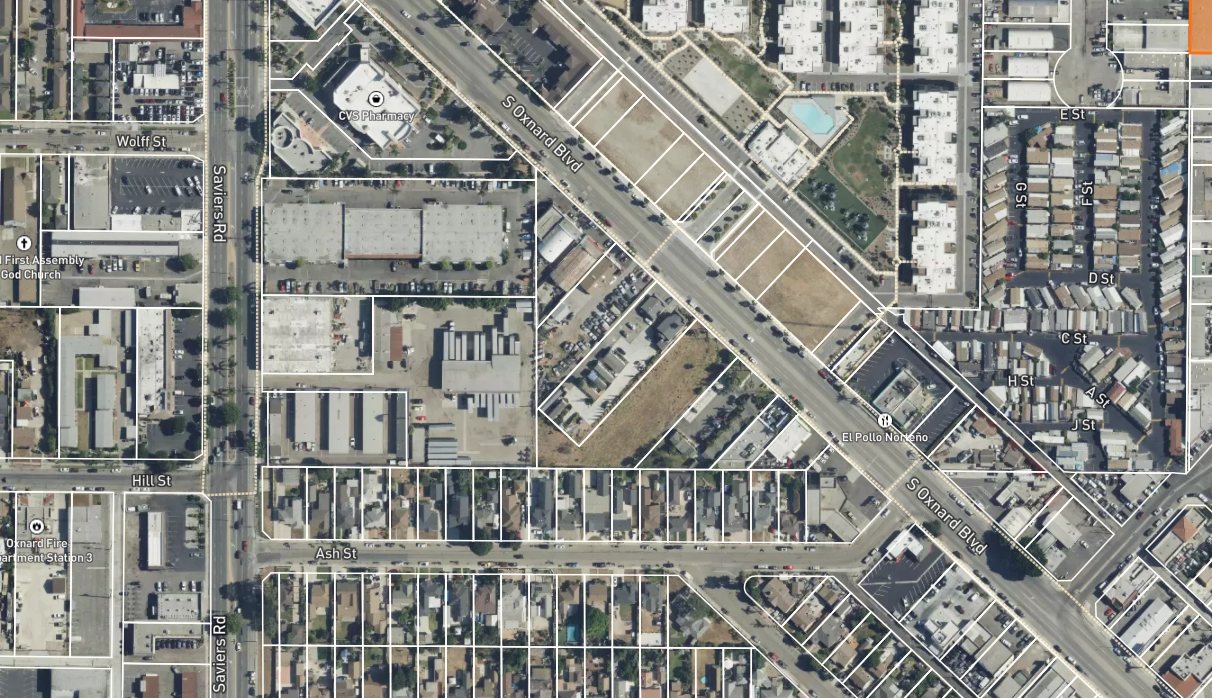
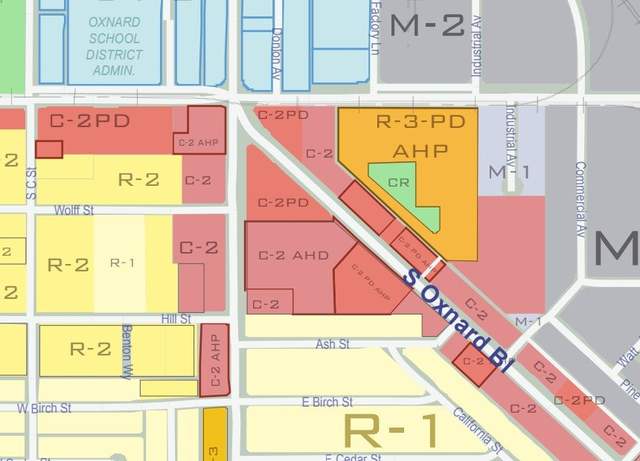
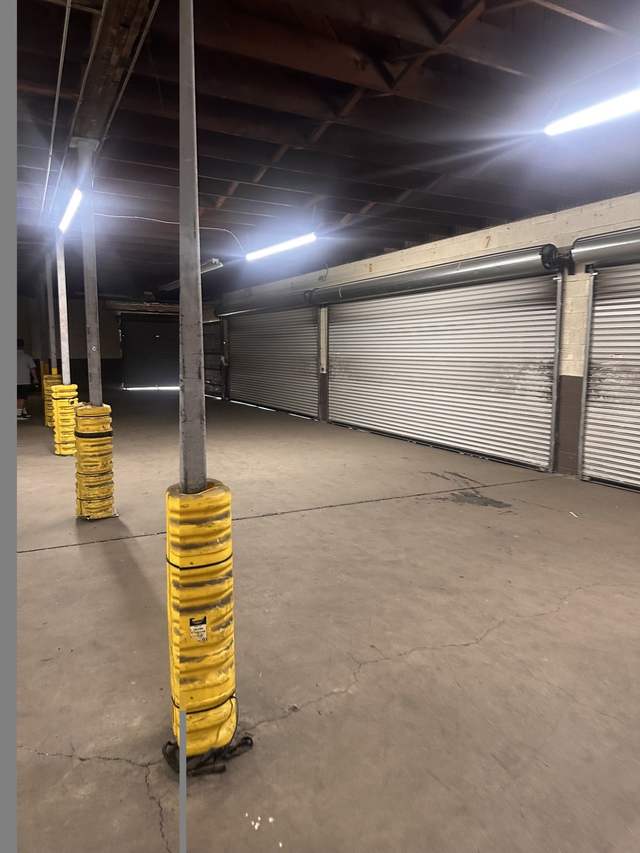
Four contiguous parcels on a single assessor's block. This opinion values each parcel on its own merits first, then looks at what the four are worth together as a single multifamily development site.
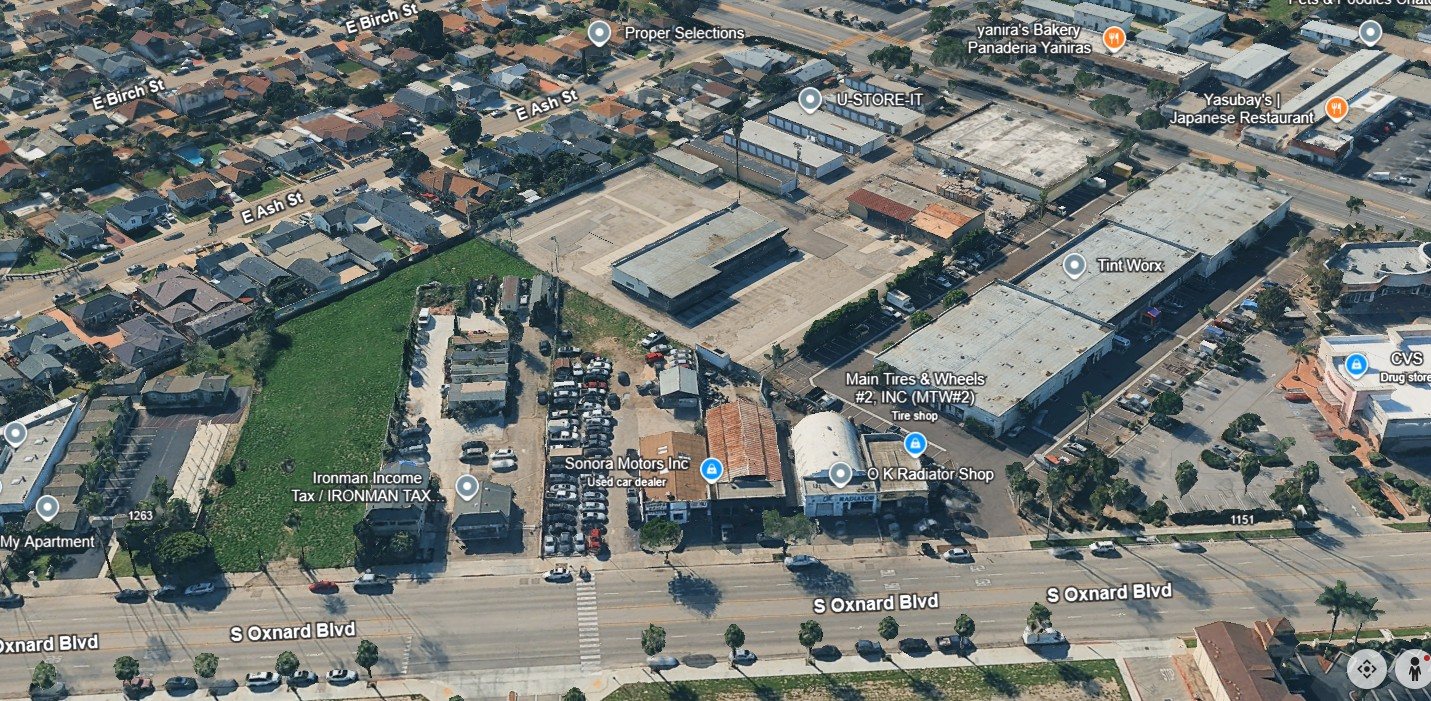
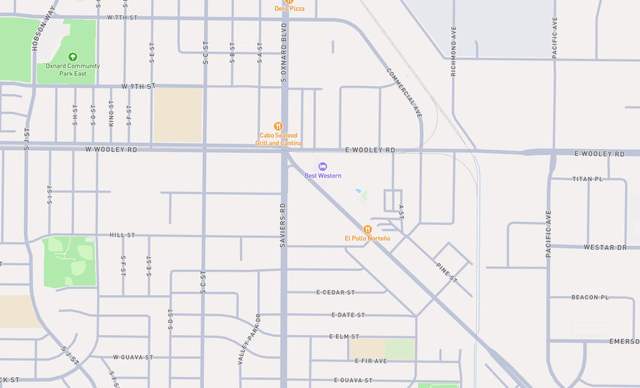
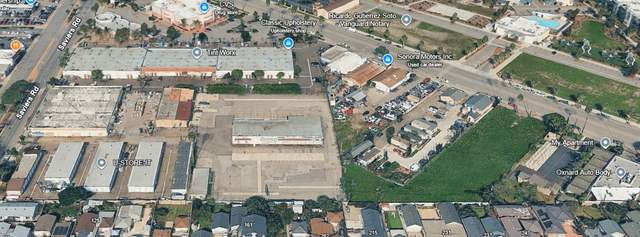
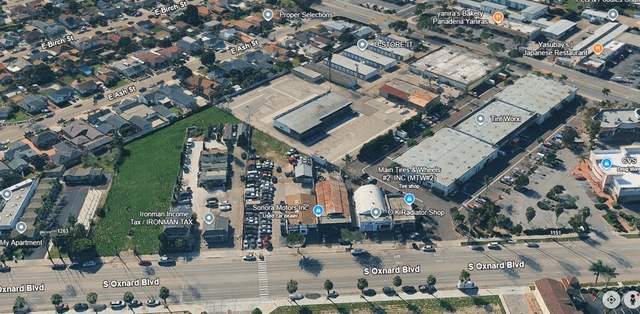
The four parcels sit together on assessor's block 204-0-060, on the southwest side of South Oxnard Boulevard, with the largest reaching back to Saviers Road. The Five Points intersection of Oxnard Boulevard, Saviers Road and Wooley Road lies 900 to 1,200 feet northwest.
You hold four appraisals from Lunetta Appraisal Company, dated May 2, 2026, that together conclude $8,545,000. Those reports carry a retrospective date of value of February 2, 2024. Two and a half years have passed, cap rates have moved, one tenant has vacated, and the land market in Oxnard has repriced. Our opinion of value reflects where these parcels stand today.
We value each parcel separately below, because each has a different buyer, a different approval path and a different reason its number has moved. The assemblage question comes at the end, where it belongs.
All four parcels come in below the appraised figures. The reasons differ by parcel: a lost nonconforming use on Saviers, a repriced land residual on 1251, cap rate expansion on 1263, and a modest market adjustment on 1225.
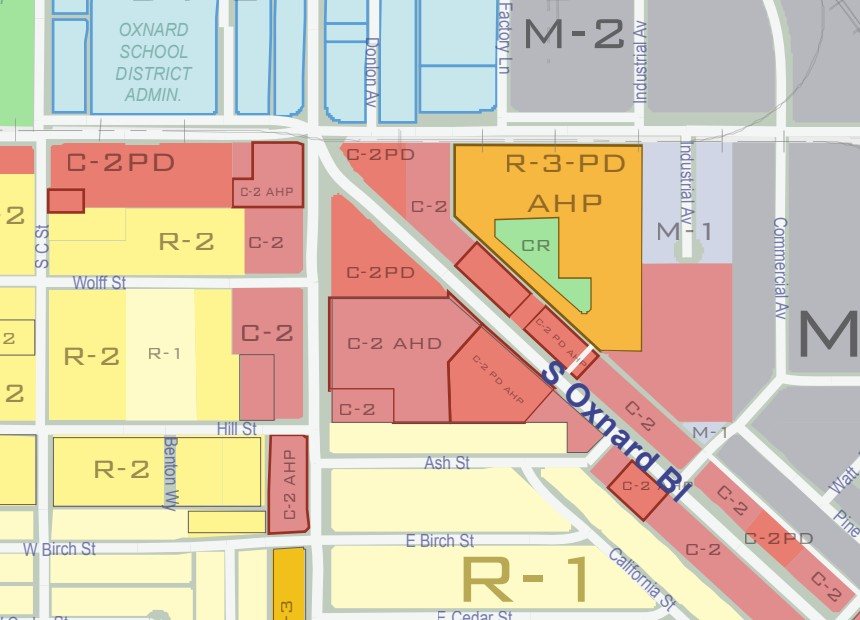
1251 and 1263 carry the ministerial AHP overlay. 1225 and 1260 carry the discretionary AHD overlay and need a Special Use Permit. That distinction drives both value and marketing strategy.
Each parcel has its own APN, its own frontage and its own buyer pool. Three of the four produce income. The whole four acres is also a genuinely scarce product on this corridor.
Retrospective to February 2, 2024. Since then the terminal went dark, 234 Johnson traded at $26.44 per land foot, and an entitled 150-unit site on Oxnard Boulevard failed to sell at $4.2 million.
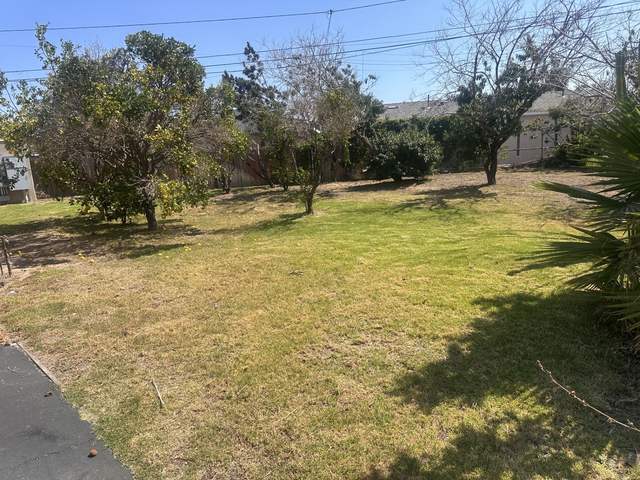
Vacant land with a ministerial approval path, which makes it the cleanest development story in the portfolio. It is also the parcel priced most directly by arithmetic rather than by comparison, because vacant land is worth what a builder can afford to pay for it, not what comparable dirt sold for.
Land value here is the finished value less what it costs to build, less the profit a developer requires to take the risk. Hard cost is modeled at $250 per square foot across 30,150 square feet, with soft costs at 15 percent of hard, and a construction loan at 8.5 percent over two years.
| Land Price | Per Buildable Unit | Per Land SF | Total Cost | Developer Profit | Profit Margin | Developer Cap |
|---|---|---|---|---|---|---|
| Our opinion of value, $1,150,000 | $31,081 | $31.06 | $9,818,413 | $2,397,428 | 18.50% | 7.22% |
| $1,050,000 | $28,378 | $28.36 | $9,718,413 | $2,508,318 | 19.35% | 7.30% |
| $950,000 | $25,676 | $25.66 | $9,618,413 | $2,619,208 | 20.21% | 7.38% |
| $850,000 | $22,973 | $22.96 | $9,518,413 | $2,730,098 | 21.07% | 7.46% |
| Bottom of sales range, $750,000 | $20,270 | $20.26 | $9,418,413 | $2,840,988 | 21.92% | 7.54% |
Our $1,150,000 leaves a developer an 18.50 percent margin on net revenues and a 7.22 percent return on cost, which is the thinnest defensible point in this ladder and therefore the right place to price. Below it the deal gets easier for the buyer, not harder. Above it the arithmetic breaks: at the appraised $1,555,000 a developer pays $42,027 per buildable unit, pushing total cost to roughly $10.2 million against a $12.96 million net sale and leaving a margin well under this range. That is why the appraised figure does not survive contact with a builder's spreadsheet.
234 Johnson Road, 0.79 acres, closed January 2026 at $910,000, or $26.44 per square foot, with expired entitlements. A five acre Ventura site sold for $5,600,000, or $25.97 per square foot, for a rezoning to 77 units with Mesa Verde and freeway frontage. In Thousand Oaks, 0.54 acres entitled for 33 units sold at $1,500,000, which works out to $45,455 per entitled unit. Our $31.06 per square foot and $31,081 per buildable unit sits above the unentitled trades and below the entitled ones, which is where an unentitled parcel with a ministerial approval path belongs.
137 W. 1st Street, at the corner of West 1st and South A Street in downtown Oxnard, is the single most useful live comparable for this parcel. It is a half acre carrying approved plans, listed in May 2026 and reduced since.
Compare it on the metric a developer actually uses. First and A asks $36,321 per entitled unit. Our opinion prices 1251 at $31,081 per buildable unit, a 14 percent discount, and that discount is doing a lot of work: it is buying entitlement risk, since 1251 has approved density under the AHP overlay but no approved plans.
On land area the two look nothing alike, $91.67 against $31.06, but that comparison is misleading. First and A is downtown DT-G at roughly 110 units per acre in a six-story Type III-A building. 1251 is a Five Points site at 43.5 units per acre. Per square foot of dirt, a site that can hold two and a half times the density should trade at a large multiple. Per door, the two converge, and per door is the honest test.
The other lesson is about timing. First and A has been on the market since May under a price reduction, with plans, reports, City approvals and seller financing all included. Entitlements are not, by themselves, producing a fast sale in this city. That argues against paying up for entitled comparables and in favor of pricing 1251 where a builder can still make an 18 percent margin.
The Ramsey Apartments. Nine fully renovated units, and the only parcel valued on its income rather than its dirt. It is also the parcel with the smallest variance, and the reason is worth stating plainly: the property is performing better than it was in 2024, but cap rates moved against it.
The appraiser capitalized $112,440 of net operating income at 4.85 percent. Today the property produces $133,226, an increase of nearly nineteen percent, driven by rents that have moved from $15,081 a month to $16,649. But the market now prices nine-unit Oxnard product closer to six percent than to five. Applying today's cap rate to today's income produces a lower number than applying a 2024 cap rate to 2024 income. That is not a criticism of the appraisal. It is what two years of rate movement does.
| Units | Type | Avg SF | Current Rent | Rent/SF | Market Rent |
|---|---|---|---|---|---|
| 1 | 2 bed / 1 bath | 540 | $2,261 | $4.19 | $2,450 |
| 7 | 1 bed / 1 bath | 440 | $1,858 | $4.22 | $1,899 |
| 1 | Studio | 220 | $1,382 | $6.28 | $1,450 |
| 9 | Total, 3,840 SF | 427 | $16,649 | $4.34 | $17,193 |
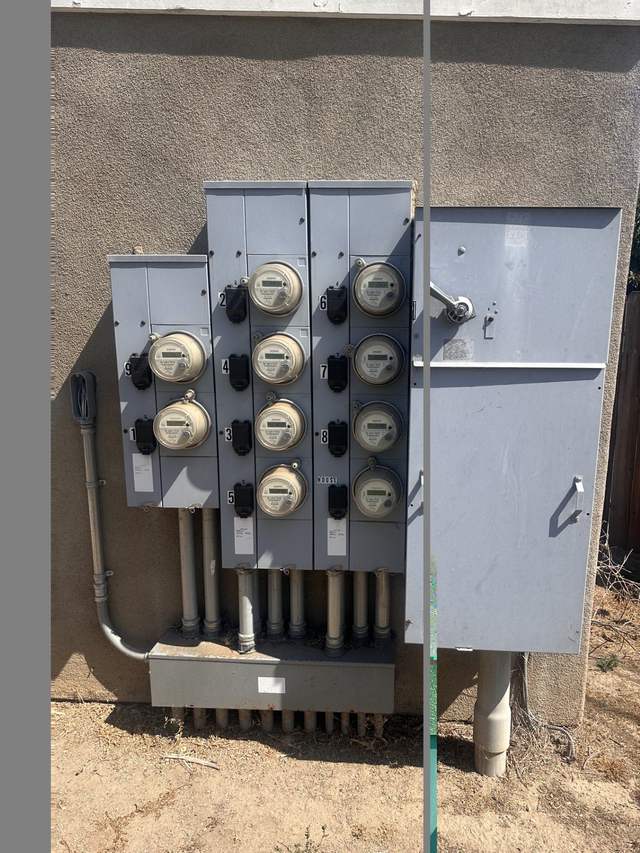
Built as a motel and completely rebuilt in 2012, with further work in 2023. Four structures: a single free-standing unit, a six-unit building, a two-unit building and a laundry building. Every unit is separately metered, with 18 open parking spaces on site.
| Current | Pro Forma | |
|---|---|---|
| Gross Scheduled Rent | $199,776 | $206,280 |
| Less vacancy at 3% | ($5,993) | ($6,188) |
| Other income | $2,400 | $2,400 |
| Effective Gross Income | $196,183 | $202,492 |
| Less expenses | ($62,957) | ($63,223) |
| Net Operating Income | $133,226 | $139,269 |
Expenses run 32.1% of effective gross, $6,995 per unit, $16.40 per square foot. Largest lines are real estate taxes at $26,508, management at $9,809, repairs and maintenance at $7,650, and water and sewer at $7,000. At our value the current cap is 6.07% and the pro forma cap is 6.34%, on a 10.99 GRM.
| Address | Submarket | Units | Bldg SF | Built | Price | $/Unit | $/SF | GRM | Cap | Date |
|---|---|---|---|---|---|---|---|---|---|---|
| 710 Janetwood Dr. | Carriage Square | 5 | 5,596 | 1965 | $1,250,000 | $250,000 | $223.37 | n/a | n/a | 01-08-2026 |
| 506 S. G St. | Hobson Park East | 10 | 2,994 | 1954 | $1,330,000 | $133,000 | $444.22 | n/a | 4.96% | 12-23-2025 |
| 541 Cuesta Del Mar Dr. | South Winds | 14 | 8,424 | 1962 | $2,825,000 | $201,786 | $335.35 | 9.40 | 6.77% | 12-05-2025 |
| 145 S. Garfield Av. | La Colonia | 5 | 3,074 | 1959 | $1,100,000 | $220,000 | $357.84 | 12.20 | 5.38% | 11-14-2025 |
| 611 S. E St. | Hobson Park East | 9 | 5,880 | 1965 | $1,575,000 | $175,000 | $267.86 | 14.58 | 4.57% | 09-19-2025 |
| Averages | 5 sales | 8.6 | 5,194 | 1961 | $1,616,000 | $195,957 | $325.73 | 12.06 | 5.42% | n/a |
| 1263 S. Oxnard Bl. | Subject at our value | 9 | 3,840 | 2012/2023 | $2,195,000 | $243,889 | $571.61 | 10.99 | 6.07% | n/a |
The subject prices above the comp set on both per unit and per square foot, and that is defensible: it is by far the newest product in the group, rebuilt in 2012 with further work in 2023 against a comp set built between 1954 and 1965, and its units are small, which lifts rent per square foot to $4.34. The 506 S. G Street figure of $444 per square foot on ten units in 2,994 square feet should be verified before it is relied on. What holds the subject value in check is the cap rate: at 6.07% it prices above the 5.42% average of this set, which is the right side of the trade for a buyer.


Diligence item worth real money
The units are reported to sit outside any local rent control ordinance and to be subject only to statewide AB 1482, which caps sitting tenants at 5 percent plus CPI to a 10 percent ceiling and leaves new tenancies uncapped. But AB 1482 exempts housing issued a certificate of occupancy within the previous 15 years, and that exemption rolls forward. This property was a motel completely rebuilt in 2012 and 2013. If that work produced a new certificate of occupancy, the units may fall outside AB 1482 entirely, and the sitting rents could be moved to market now rather than at 8 percent a year. Pull the certificates of occupancy and confirm with counsel before the offering is finalized.
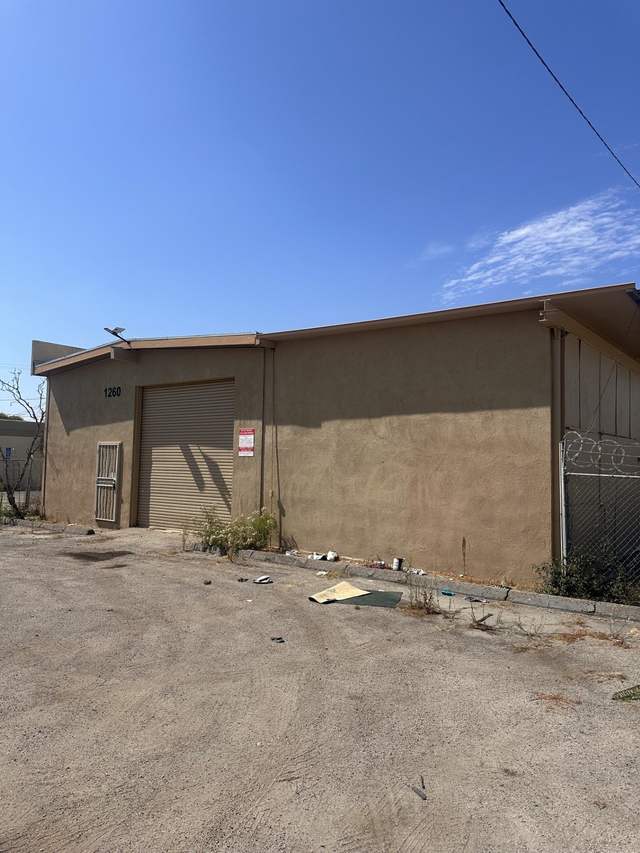
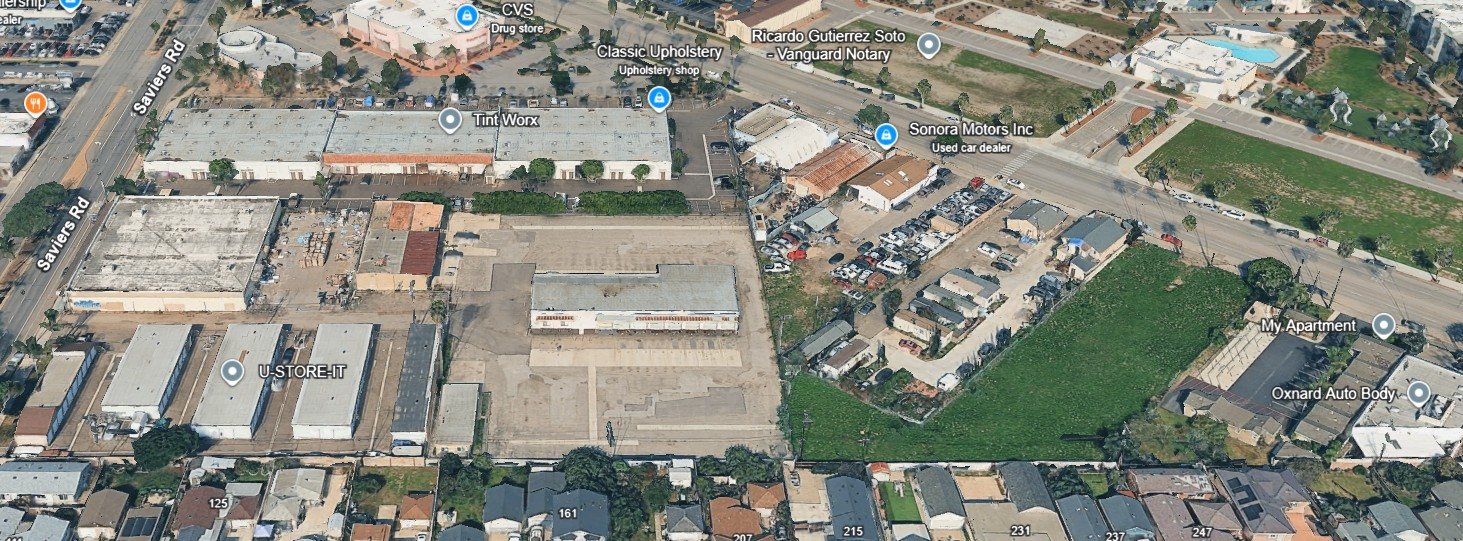
The largest parcel in the portfolio at 2.01 acres, and the one where our opinion departs furthest from the appraisal. A change in zoning status, not a change in the market, drives that gap.
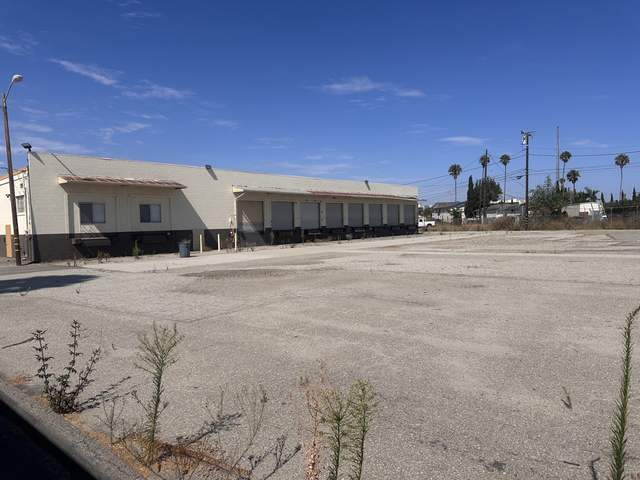
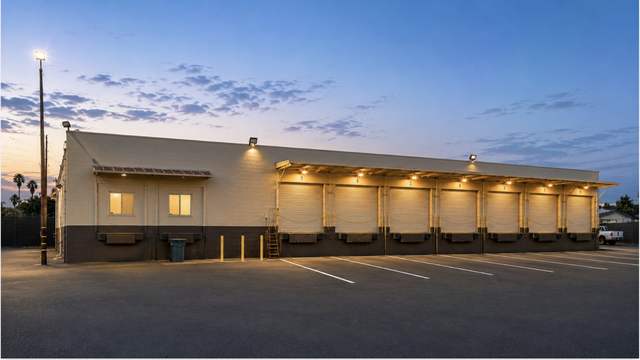
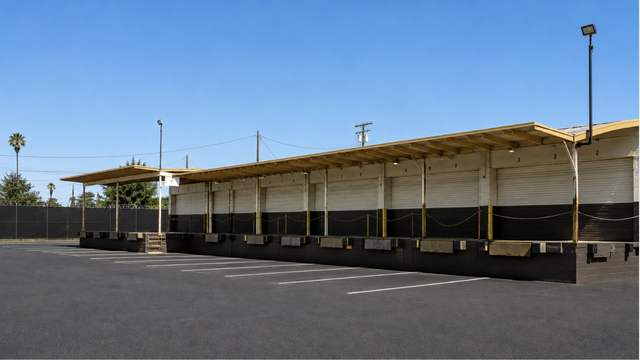
The building sat vacant for more than six months. With that, the legal nonconforming status that allowed the industrial use lapsed. Any new use now has to comply with current C-2 zoning, which does not permit the truck terminal operation this building was designed and built for.
That is the single largest driver of our opinion of value on this parcel, and it appears nowhere in the appraisal. The appraiser valued the site at $40 per foot as multifamily land and separately tested it as a continuing industrial use at $25.46. Neither test contemplates that the industrial path has closed.
Self-storage may be permitted subject to a Special Use Permit and Planned Development approval. There is precedent on both sides: U-Haul operates a 202,741 square foot facility at 35 feet of height in a C-2 zone at 2420 N. Oxnard Boulevard, and a U-Store-It sits immediately southwest of this parcel.
Multifamily at 30 units per acre under the AHD overlay, subject to a Special Use Permit. A short-term yard re-lease would restore part of the carry without encumbering an entitlement timeline.
The cleanest test is 965 Maulhardt, a functional twin: a cross-dock building of about 8,000 square feet on 2.23 acres, sold to a freight logistics operator running 148 cross-dock properties nationally. It cleared at $27.28 per land square foot with M-2 zoning that permits the use. Our subject cannot even offer the use.
| Address | Bldg SF | Land SF | Price | $/Bldg SF | $/Land SF | Date | Zoning |
|---|---|---|---|---|---|---|---|
| 965 Maulhardt, cross-dock | 7,994 | 97,138 | $2,650,000 | $331.50 | $27.28 | 01-2024 | M-2 |
| 2571 Cortez Cir. | 43,200 | 196,020 | $5,500,000 | $127.31 | $28.06 | 06-2026 | M-2 |
| 2951 W. 5th St. | 35,000 | 87,120 | $3,000,000 | $85.71 | $34.44 | 08-2025 | MPD |
| 1114-1230 E. 5th St. | 22,360 | 93,654 | $4,000,000 | $178.89 | $42.71 | 10-2025 | M-2 |
| 635 S. Rose Av. | 10,800 | 32,670 | $2,050,000 | $189.81 | $62.75 | 03-2026 | M-2 |
| 220 Bernouli Cir. | 14,189 | 33,977 | $2,875,000 | $202.62 | $84.62 | 05-2026 | Industrial |
| 6541 Ventura Bl. | 5,000 | 10,063 | $950,000 | $190.00 | $94.41 | 09-2024 | MPD |
| 1801 Sunkist Cir. | 8,113 | 12,632 | $1,612,500 | $198.76 | $127.65 | 03-2026 | M-1PD |
| Totals and averages | 138,662 | 466,136 | $19,987,500 | $167.59 | $67.80 | n/a | n/a |
Every one of these sits in an M-1, M-2 or MPD zone that permits the uses the buyer needed. The $67.80 average is the value this parcel cannot reach, and the $27.28 twin is the honest ceiling for a building like ours. Our $28.50 sits just above it, which is appropriate given the larger site and the residential overlay.


The smallest of the three commercial parcels and the one that holds its value best. Small auto-related commercial property on a boulevard corner trades at a premium per square foot, and this one has two tenants paying rent today.
Both tenancies being month to month matters twice over. It means the in-place rent is well below market and can be reset quickly, and it means a redevelopment buyer can clear the site without a lease buyout.
1101 Saviers Road is the closest analog in the market. Used car and auto repair on 1.54 acres at the Five Points signalized intersection, one tenth of a mile from the subject, with the same additive zone treatment. Small building on a large parcel, so the value is in the land, and it traded at $38.26 per land square foot. It is a better site than ours: a corner with an efficient rectangular shape. Our $38.00 sits just underneath it.
| Address | Type | Bldg SF | Land SF | Price | $/Bldg SF | $/Land SF | Date | Zoning | Mi. |
|---|---|---|---|---|---|---|---|---|---|
| 1101 Saviers Rd. | Used car and auto repair | 4,814 | 65,340 | $2,500,000 | $519.32 | $38.26 | 11-2025 | C-2 AHP | 0.1 |
| 1177 Saviers Rd. | Used car lot | 3,034 | 25,265 | $1,200,000 | $395.52 | $47.50 | 07-2026 | C-2 | 0.1 |
| 2010 Saviers Rd. | Retail storefront | 3,966 | 8,419 | $500,000 | $126.07 | $59.39 | 05-2026 | C-2 | 0.5 |
| 3150 Saviers Rd. | Retail store | 7,000 | 20,473 | $1,500,000 | $214.29 | $73.27 | 08-2024 | C-2 | 1.1 |
| 1505 S. Oxnard Bl. | Retail storefront | 3,800 | 7,405 | $575,000 | $151.32 | $77.65 | 09-2025 | C-2 | 0.2 |
| 1555 S. Oxnard Bl. | Auto parts retail with yard | 6,325 | 22,651 | $2,400,000 | $379.45 | $105.96 | 03-2025 | C-2 | 0.18 |
| 1712-1722 Saviers Rd. | Retail storefront | 9,459 | 27,007 | $3,200,000 | $338.30 | $118.49 | 07-2026 | C-2 | 0.4 |
| 338 W. 5th and 548 W. 6th St. | Retail storefront | 10,323 | 15,079 | $2,420,000 | $234.43 | $160.49 | 06-2026 | CBD | 0.8 |
The parcels at the top of this range are corners with better visibility, shape and access, and several sold at a premium to owner-users under plain C-2 zoning, which permits more uses than C-2 with the AHD suffix. Sorted by land value, the subject belongs at the lower end.
The parcel valuations above rest on this evidence. It is not a flattering picture, and the offering material is stronger for acknowledging it up front rather than letting a buyer discover it.
| Address | Land SF | Price | $/Land SF | Date | Zoning | Notes |
|---|---|---|---|---|---|---|
| 234 Johnson Dr. | 34,412 | $910,000 | $26.44 | 01-23-2026 | R-2 AH | Infill site for roughly 35 units, utilities on site, seller financing offered. On market 184 days across four price cuts, closing 34% below the original ask. Entitlements had expired. |
| 1501 N. Oxnard Bl., also known as 1345 | 130,680 | $4,000,000 | $30.61 | In escrow | C-2-PD | Northerly 3 acres of an auto dealership, entitled for 150 units. Marketed by our team at $4,200,000 without a sale, now reported in escrow at $4,000,000. The escrow price, not the ask, is the clearing level. |
| 145 N. Harrison Av. | 68,174 | $2,170,000 | $31.83 | In escrow | C-2-PD, AHD | On market 35 months at the price shown. Closing price not available. Carries the same AHD overlay as our two largest parcels. |
| 2100 E. Pleasant Valley Rd. | 22,216 | $985,000 | $44.34 | 03-09-2026 | C-2-PD, AHD | Half-acre signalized corner across from Oxnard College. Zoning allowed 9 market rate townhomes or 15 affordable units. Buyer is building EV charging stations. |
| 6001 Arcturus Av. | 392,476 | $10,400,000 | $26.50 | 02-26-2025 | M-1 | Purchased to build refrigerated storage serving Port Hueneme agricultural logistics. |
| Average across the five | n/a | n/a | $31.94 | n/a | n/a | n/a |
Note the holding periods as much as the prices. 234 Johnson took 184 days and four reductions. 145 N. Harrison sat 35 months. This is not a market where land clears quickly at asking.
| Property | Status | Price | Units | Per Unit | $/Land SF | Notes |
|---|---|---|---|---|---|---|
| 1501 N. Oxnard Bl. | Offered unsold, now in escrow | $4,200,000 | 150 | $28,000 | $31.41 | Fully entitled, 125,916 net rentable SF, four stories, 181 parking spaces. Withdrawn unsold at the price shown, now in escrow at $4,000,000. |
| 1620 Ives Av. | Went to auction, December | $5,100,000 | 78 | $65,385 | $40.37 | 2.90 acres, BRP with the same AHD overlay as our largest parcels, entitled for 78 units. Carried an accepted offer at the price shown, then went to auction. Outcome to be confirmed. |
| 137 W. 1st St., First and A | On market since May 2026, reduced | $1,925,000 | 53 | $36,321 | $91.67 | 0.4821 acres on a corner with alley access, entitled for a six-story, 44,338 SF building: 48 one-bedroom, 5 two-bedroom, 6 affordable, Type III-A with no podium, 29 covered spaces and a 2,846 SF rooftop terrace. Existing 5,900 SF commercial building and 3,900 SF garage produce $2,500 a month. Plans, reports and City approvals included; owner may carry a first. Zoned DT-G in the Downtown Specific Plan, a stronger location than Five Points. Discussed in full in the 1251 section. |
Entitlements alone are not moving product in this city. That cuts two ways for us: it argues against paying up for an entitled comp, and it argues for the ministerial certainty that 1251 and 1263 already carry.
| Address | Type | Bldg SF | Land SF | Asking | $/Bldg SF | $/Land SF | Notes |
|---|---|---|---|---|---|---|---|
| 1258 Saviers Rd. | Retail storefront | 17,500 | 27,878 | $2,750,000 | $157.14 | $98.64 | Directly adjacent to the subject. 125 to 140 feet of frontage, 28 rear spaces, 1964 construction with 9 foot 8 inch ceilings. On market 7 months under price reductions, also offered for lease at $0.75 per foot. No AHD overlay. |
| 1222-1230 Saviers Rd. | Multi-tenant industrial, 42 units | 40,213 | 103,673 | $6,700,000 | $166.61 | $64.63 | At Five Points. 94% occupied, proforma NOI $381,232, 5.69% cap, built 1978. Units of 576 to 1,200 SF with roll-up doors and 3-phase power. |
| 1032 and 1060 S. Oxnard, 119 E. Wooley | Retail and restaurant | 8,756 | 35,718 | $5,300,000 | $605.30 | $148.38 | Three contiguous parcels at the NE corner of Five Points, roughly 50,000 vehicles per day. Month-to-month tenants at low rents, marketed as a redevelopment play. |
| 2100-2228 Saviers Rd. | Multi-tenant retail | 23,284 | 73,869 | $6,450,000 | $277.01 | $87.32 | Stabilized center, 5.66% cap on $365,341 NOI, 91% occupied, 443 feet of frontage, built 1980. 17 days on market. |
| 536-546 S. Oxnard Bl. | Retail storefront | 12,555 | 13,939 | $2,550,000 | $203.11 | $182.94 | Two contiguous vacant storefronts available for an owner-user. On market 2 months. |
| 258 W. Pleasant Valley Rd. | Mixed use | 3,000 | 38,224 | $3,500,000 | n/a | $91.57 | Two houses and a small restaurant generating $110,400 a year gross. Marketed as a covered land play while pursuing entitlements. |
Asking prices here average $212.42 per building square foot and $112.86 per land square foot. Our site is discounted against them for its unconventional configuration, poor visibility and constrained access, and because the building at 1260 is not well suited to most commercial operations, which narrows the buyer pool.
Oxnard is the largest city in Ventura County at just over 200,000 people, and the only city in the county without a strict growth control ordinance. Saviers Road runs three miles from Five Points south to Hueneme Road, anchored at Channel Islands Boulevard by the 290,000 square foot Walmart-anchored Centerpoint Mall and the 180,000 square foot Island Plaza across the street.
| 2024 | 1 Mile | 3 Miles | 5 Miles |
|---|---|---|---|
| Population | 28,148 | 193,241 | 233,904 |
| Employees | 10,147 | 46,044 | 69,033 |
| Traffic Counts | Vehicles per Day |
|---|---|
| Saviers Rd. at Wolff St. | 30,100 |
| S. Oxnard Bl. at E. Wooley Rd. | 19,344 |
| Five Points intersection, NE corner | roughly 50,000 |
Radius demographics and the first two traffic counts are from the marketing flyer for 1258 Saviers Road, the parcel adjacent to the subject.
Housing Element Program 31 covers the Oxnard Boulevard Corridor and High Quality Transit Corridor site selection. In 2016 the City completed a $250,000 study on transforming a 7.2 mile stretch of Oxnard Boulevard into complete streets capable of serving new medium and high density transit-oriented mixed use and affordable housing. Program 31 added Saviers Road to that study area, and the City has since been awarded a SCAG grant to implement it. The subject sits at the junction of the two streets that define the corridor.
| Metric | Oxnard | Ventura Co. | California |
|---|---|---|---|
| Population | 200,637 | n/a | n/a |
| Median age | 35.4 | 40.2 | 38.4 |
| Median household income | $101,184 | $114,238 | $100,149 |
| Median home value | $698,000 | $869,300 | $759,500 |
| Renter share | 42.5% | 34.0% | 44.2% |
| Average renter household | 3.74 | 2.92 | 2.63 |
| Median gross rent | $2,111 | $2,313 | $2,104 |
| Renter households overcrowded | 28.6% | 14.9% | 12.9% |
U.S. Census Bureau, American Community Survey 2024 one-year estimates. Overcrowded means more than one occupant per room.
Oxnard's median household income is roughly the same as California's and its rent is roughly the same as California's. What is not the same is how many people are packed into each unit. The average Oxnard renter household holds 3.74 people against 2.63 statewide, and 28.6 percent of renter households live at more than one person per room, more than double the state rate.
| Income Level | RHNA | Permitted | Remaining | Complete |
|---|---|---|---|---|
| Very Low | 1,840 | 215 | 1,625 | 11.7% |
| Low | 1,071 | 656 | 415 | 61.3% |
| Moderate | 1,538 | 79 | 1,459 | 5.1% |
| Above Moderate | 4,100 | 793 | 3,307 | 19.3% |
| Total | 8,549 | 1,743 | 6,806 | 20.4% |
City of Oxnard 2024 General Plan Annual Progress Report, Table 3, covering the 2021 to 2029 cycle. Roughly half the cycle has elapsed and 20.4% of the obligation has been permitted, leaving 3,499 income-restricted units outstanding.
| City | 2020 | 2025 | Change | Percent |
|---|---|---|---|---|
| Oxnard | 202,066 | 198,733 | (3,333) | 1.65% |
| Ventura | 110,737 | 108,985 | (1,752) | 1.58% |
| Camarillo | 70,744 | 68,927 | (1,817) | 2.57% |
| Port Hueneme | 21,958 | 20,838 | (1,120) | 5.10% |
| West Ventura County | 405,505 | 397,483 | (8,022) | 1.98% |
A shrinking population is not, on its face, an argument for building more housing, and a buyer will raise it. The counterargument is the appraiser's own: growth across these cities turned negative around 2020, and he attributes the trend to a deficit of affordable housing rather than a lack of demand for it. Households that cannot find a unit they can afford leave, or double up. The 28.6 percent overcrowding rate is what that looks like for the households that stayed.
Ventura County assignments are led by Logan Ward, the LAAA Team's specialist for the Ventura and Santa Barbara County corridor, working alongside Gary Cohen, Managing Director Investments. Logan and Gary partner with co-founders Glen Scher and Filip Niculete, senior managing directors who together have closed more than $1.4 billion in transactions across Los Angeles, Ventura and Santa Barbara counties.
We would welcome the chance to walk through each parcel, the buyer pools and the two-track go-to-market plan in person. Reach out to any member of the team above and we will coordinate a meeting at your convenience.